
Google Analytics is one of the most powerful (and free, free is important) tools available in a modern marketer’s arsenal.
You should have it on your site, and if you don’t, you can get started really quickly and start tracking visitors right here. This article will show you how to find and measure many of your crucial marketing metrics with it.
Some of the metrics I share here are going to be red flags at some point in time, but you won’t know which ones are red flags until you have a good understanding of what a baseline is for these metrics on your website.
If something dips far below the usual variance (at least two weeks of data) then you most likely have a problem and should take some action to correct it.
Dashboard Google Analytics metrics
When you first land on Google Analytics, you’ll see the Audience Overview page. This will give you info on the following:
Sessions – the number of times a user opened a browser to a page on your site.
Users – the number of unique users that opened those pages on your site.
Pageviews – the number of pages viewed by a user during a session. This will likely be higher than sessions.
Pages/Session – the number of pages divided by the number of sessions.
Average Session Duration – the average amount of time of each session. Users can have multiple sessions.
Bounce Rate – the percentage of single-page sessions that left without interacting with your page.
% New Sessions – new sessions made by new users.
That’s a great place to start, but what’s next? Those metrics won’t give you the insight you need to make meaningful changes to your website that drive more traffic, convert more leads, and increase the quality of those leads to help fill your sales pipeline.
1. Source
One of the easiest and most important metrics to find and measure: source; in other words, where your website traffic originated from. (i.e. Search engine, if they clicked on an email link, etc. )
To find this, click Acquisition, then Overview, and you can see which sources are giving you the most traffic.

Don’t stop there! Click into one of them to find out more.
For the five metrics below, hit Behavior, then Site Content, then All Pages.

2. Pageviews vs unique pageviews
Page views are just that, views of pages. On Google Analytics, unique page views take into account the same user going to a single page multiple times per session.
I mean, if your content is truly remarkable, they’ll keep coming back. Unique page views are a very strong indicator of this, but take them with a grain of salt.
3. Average time on page
This is the amount of time spent on a single page. Aim for more time if possible. The longer someone is willing to spend on your page (a blog article, especially) is great indication of the quality and engagement your content. Time on your solutions and homepage is great as well.
4. Entrances
These, according to API Explorer, are “the number of pageviews for the first page a visitor “lands on” when visiting a website (a metric). In other words, it is the number of time that particular page was the first page viewed on the session….”
For example, a visitor enters your site and navigates to two pages. Google analytics will report as follows:
Page A: Entrances= 1, Pageviews= 1 and sessions=1
Page B: Entrances=0, Pageviews=1, sessions=0.
Page B does not have an entrance as it was not the first page visited during the session.
They should not be confused with an Entrance Page, which is the first page that someone sees on your site.
5. Bounce rate
This is the percentage of single-page sessions that left without interacting further; in other words, they left your website entirely. Keep an eye on it and if any pages change drastically (or the whole site does), then you need to do some investigating.
6. Exit percentage
This is the page that was last in a given session. A visitor could have viewed a hundred pages, then left on a certain one, but if a page has a very high exit rate, there might be something you can do to keep visitors from leaving. An exit-intent popup, maybe?
7. Locations
Where are your visitors coming from? Now you can find out by country. You can also use this data to filter by when looking at other sections of Google Analytics.
To find it, click on Audience, then Geo, then Location.

8. Device usage
Your website should be responsive no matter how it’s built, but knowing the percentage of users coming to your site via different sources is going to give you an extra edge. It allows you to optimize for their usage, set up a Hotjar instance to track it, and create an entirely unique experience on each.
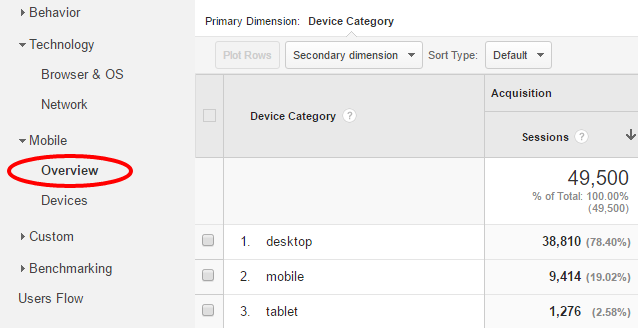
Click on Audience, then Mobile, then Overview.
9. Behavior flow
Behavior Flow looks scary, but digest it slowly.
This lets you see how people go through your site, based on some type of acquisition. You can also click into individual pages, highlight specific pages, and sort by acquisition type: source, medium, channel, etc. To get there, click on Behavior, then Behavior Flow.

This tool gives you a lot of information at once, so play around with it!
10. Landing pages
These aren’t pages designed to turn visitors into contacts or leads like the landing pages you’re probably thinking of.
In Google Analytics terms, this means that this is the first page that someone sees on your site — very similar to Entrance Pages.
It’s the page that they land on. It’s important because you can optimize those pages first so that your users are getting a great experience (and being qualified) as soon as they get to your website.

To get there, click on Behavior, then Site Content, then Landing Pages.
11. Site speed
This is an important ranking factor, an incredibly important usability factor, and an even more important competitive factor.
If a page on your site doesn’t load quickly enough, a user will likely bounce, and find another, faster loading page from which to gather information.
They won’t even see your content. It’s a marketer’s nightmare. Don’t let it happen to you!

To get there, click on Behavior, then Site Speed, then Overview.
The real power of Google Analytics comes from cross-referencing the metrics above. How fast are pages loading for visitors in Connecticut, and what’s the bounce rate for those visitors? Is there any correlation there?
Dive in, see what you can find, and update your website to keep visitors on it for longer.
Happy Analyzing!